Weekly Metrics Report

Generate and email AI-written sales reports from spreadsheet data every week
Created by
Relay.app logoRelay.app Team
Relay.app screenshot of: Weekly Metrics Report

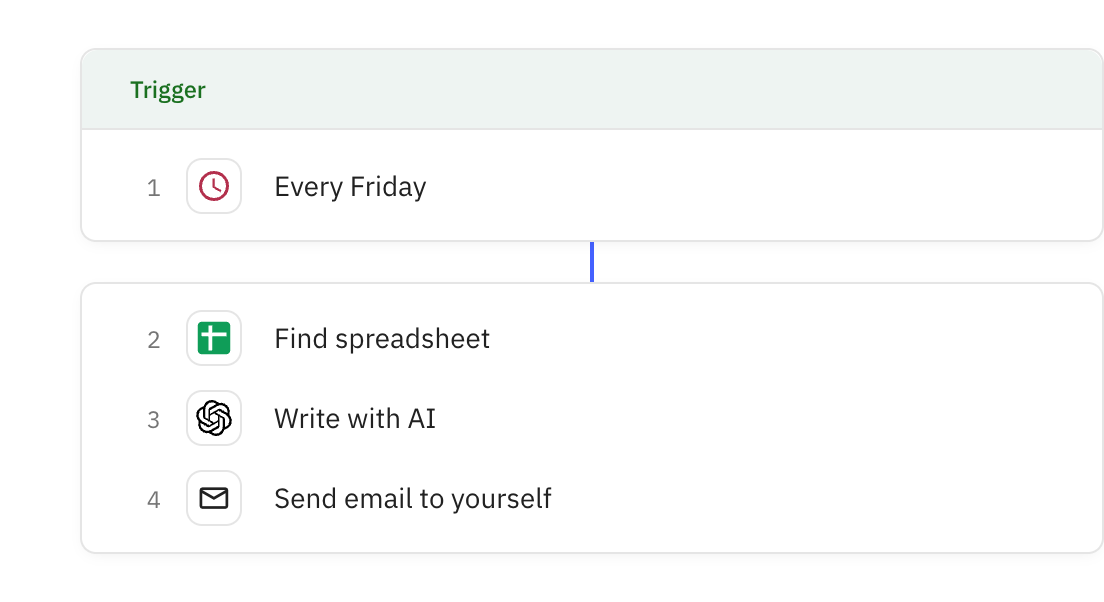
Steps in this workflow

1
Relay.app logo
Trigger
2
Google Sheets logo
Find spreadsheet(s)
3
Relay.app logo
Write with AI
4
Relay.app logo
Send email to yourself

Generate a concise, AI-written sales report from a spreadsheet each week and email it to yourself for quick performance insights. Here's how it works:

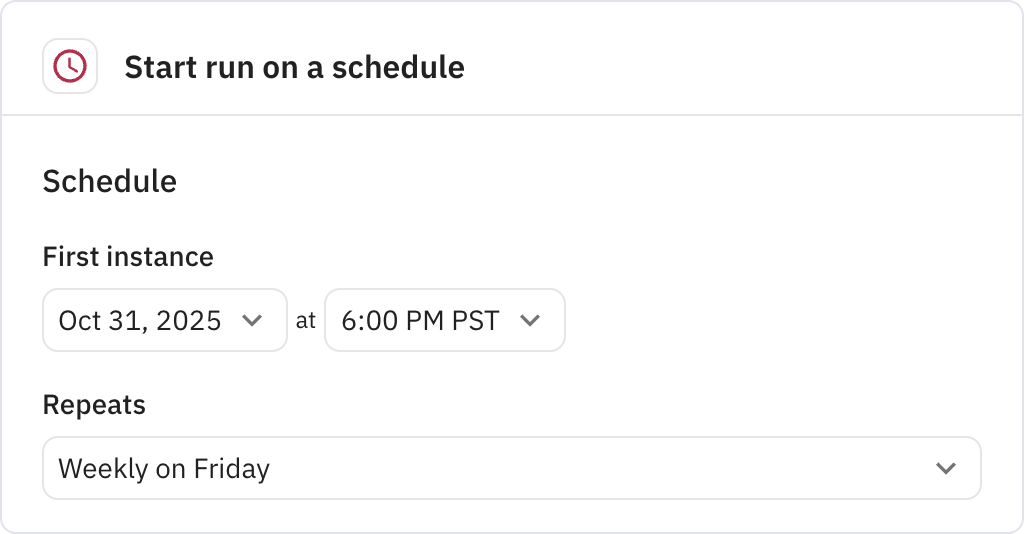
  • The workflow runs automatically every Friday at your configured time
  • It finds your sales data spreadsheet and analyzes the information
  • An AI model writes a detailed report with statistics and customer insights
  • The formatted report is emailed directly to you for easy review
1
Relay.app logo
Trigger

Starts the workflow on a recurring schedule that you configure. The workflow will run automatically at the specified time each week.

Relay.app screenshot of: Trigger
2
Google Sheets logo
Find spreadsheet(s)

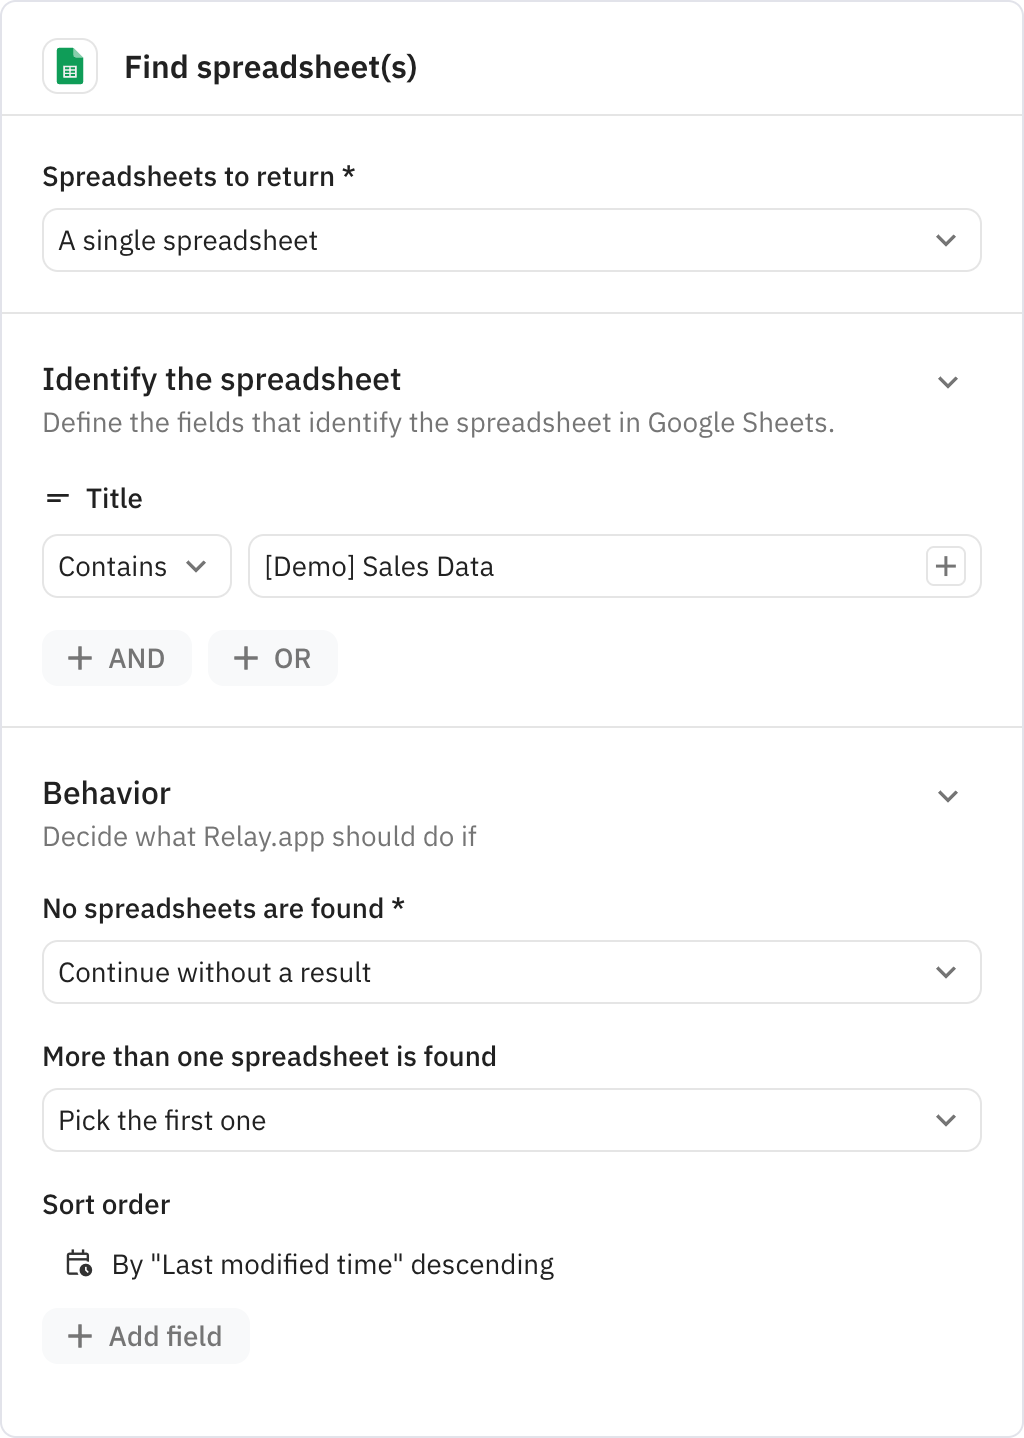
Searches for and retrieves a Google Sheets spreadsheet based on title criteria you specify. If multiple matches are found, it will select the first one, or you can configure it to pause for manual selection.

Relay.app screenshot of: Find spreadsheet(s)
3
Write with AI

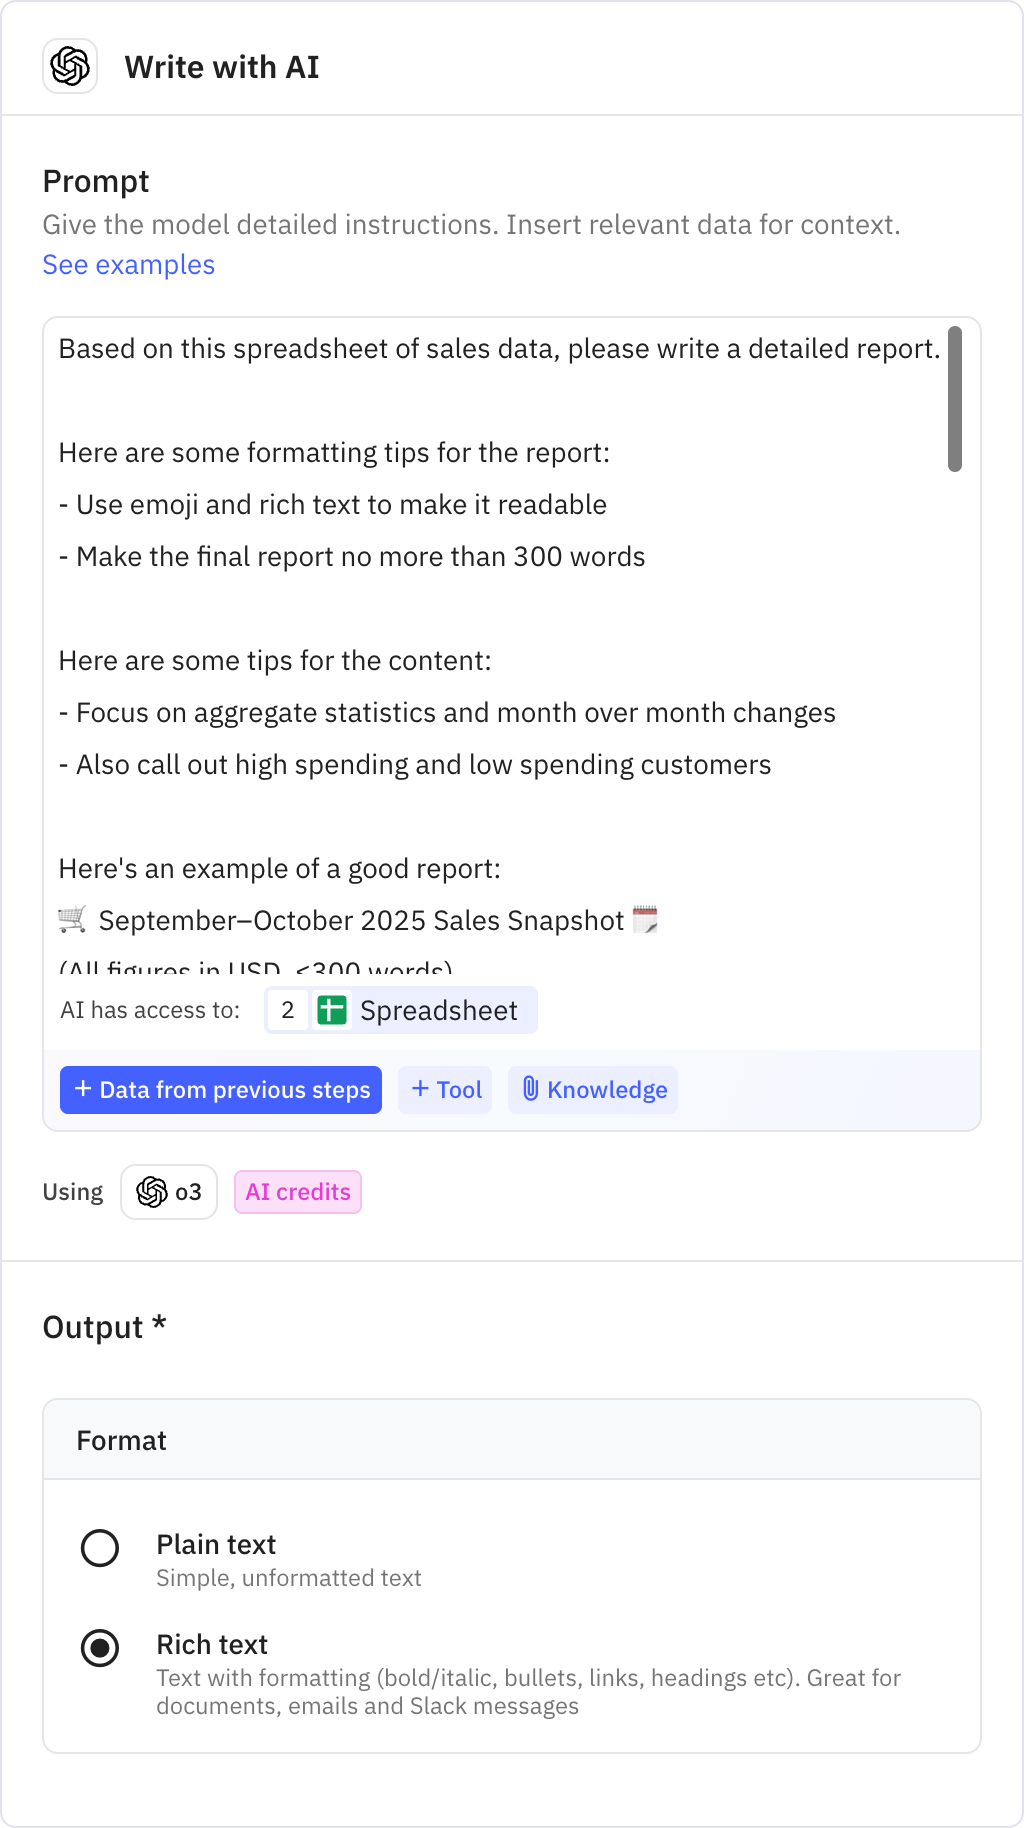
Uses an AI model to analyze the spreadsheet data and generate a comprehensive sales report. The AI creates a formatted report with aggregate statistics, month-over-month changes, and customer spending patterns.

Prompt used
Based on this spreadsheet of sales data, please write a detailed report. Here are some formatting tips for the report: - Use emoji and rich text to make it readable - Make the final report no more than 300 words Here are some tips for the content: - Focus on aggregate statistics and month over month changes - Also call out high spending and low spending customers Here's an example of a good report: 🛒 September–October 2025 Sales Snapshot 🗓️ (All figures in USD, ≤300 words) 1️⃣ Aggregate Performance • Total sales: $1,642 from 3 transactions. • Average ticket: $547. 2️⃣ Month-over-Month Momentum 🚀 • September (1 txn): $465 • October (2 txns): $1,177 • MoM change: +$712 (+153 %) ➡️ October more than doubled September’s revenue. 3️⃣ Customer Contribution Mix 📊 • Burger King: $962 (59 % of total) • McDonalds: $465 (28 %) • Wendys: $215 (13 %) 4️⃣ High vs. Low Spenders 🌟 • 🏆 Top spender: Burger King with a single purchase of $962—driving the bulk of October’s surge. • 💤 Most frugal: Wendys at $215. Monitoring upsell opportunities here could lift overall average. 5️⃣ Key Insights & Actions 💡 • October’s +153 % upswing is powered by one large corporate order; sustaining growth will require either repeat orders from Burger King or diversification of high-value clients. • McDonalds offers stable mid-range revenue; consider loyalty incentives to nudge order size toward Burger King levels. • Wendys’ low spend signals room for bundle or volume promotions. 6️⃣ Outlook 🔮 Maintain momentum by: • Prioritizing personalized outreach to Burger King to secure recurring purchases. • Introducing tiered discounts to elevate McDonalds and Wendys toward the $600+ bracket, raising the average ticket and cushioning against single-client volatility. 📈 Stay focused on nurturing high-value relationships while activating under-engaged customers to keep the growth curve pointing upward!
Relay.app screenshot of: Write with AI
4
Relay.app logo
Send email to yourself

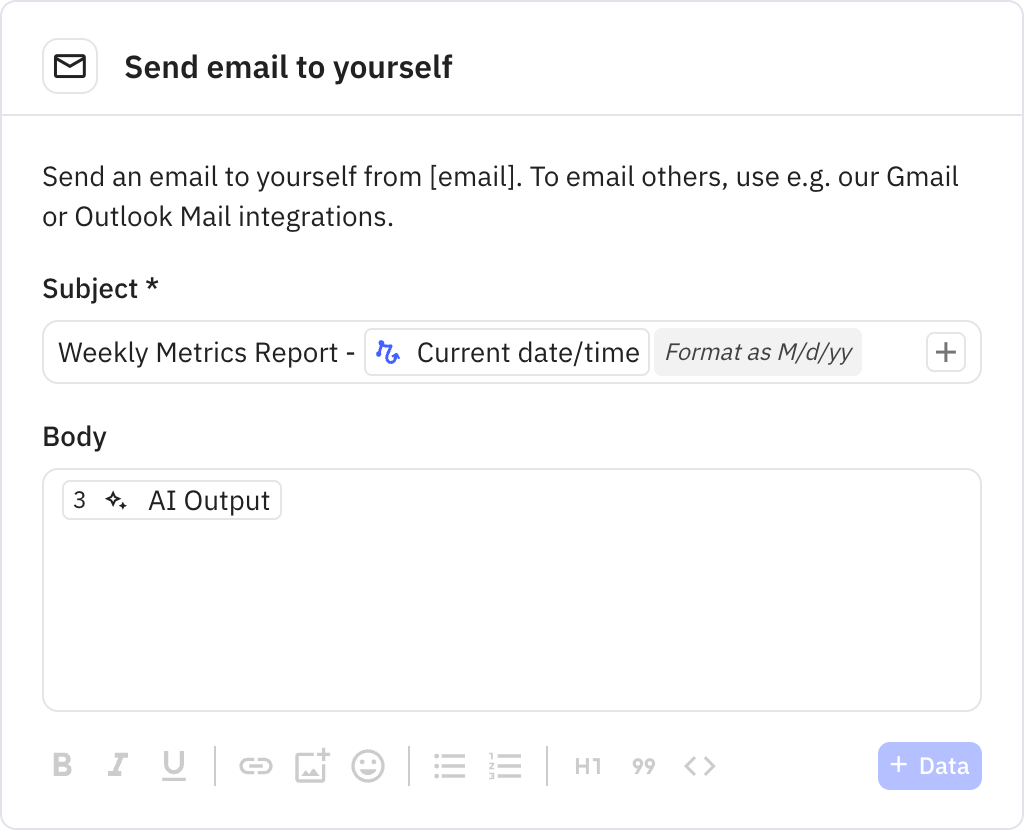
Sends the AI-generated sales report to you via email. The report is delivered with a customizable subject line and the full formatted content in the email body.

Relay.app screenshot of: Send email to yourself